| Home | E-Submission | Sitemap | Editorial Office |  
top_img
Korean Journal of Otorhinolaryngology-Head and Neck Surgery > Volume 64(2); 2021 > Article
치매 환자를 위한 청각 검사의 체계적 문헌 고찰 및 메타 분석

Abstract

It is acknowledged that there is a negative relationship between dementia and auditory function in older adults. This study conducted a systematic review and meta-analysis based on the data of audiologic testings from patients with neurodegenerative diseases in terms of auditory eventrelated potentials and central auditory processing tests, while focusing on Alzheimer’s disease (AD), dementia with Lewy bodies (DLB), and Parkinson’s disease dementia (PDD). A total of 34765 articles were retrieved from the seven electronic databases. After being screened by Participants, Index test, Control, Outcomes, Study design (PICOS) criteria, 129 articles for AD were included and then 72 articles were applied to the meta-analysis. However, five and six articles were systematically reviewed for the auditory functions of DLB and PDD, respectively, due to a small number of articles. The results of meta-analysis showed a significant difference between patients with AD and age-matched normal subjects, for N200 and P300 latency, P300 amplitude, and the behavioral central auditory processing tests, although there was a high heterogeneity. On the other hand, the systematic review indicated that the results of mismatch negativity test might distinguish auditory performance of DLB patients from that of PDD. Furthermore, for P300 amplitude, anterior to posterior distribution of brain resulted in meaningful difference of auditory function between AD and DLB patients. In sum, current review study suggests that lesion and degree of auditory (dys)function may be different depending on the type of dementia, although future research should be followed.

서 론

최근 청각 기능의 결손이 치매의 위험 요인으로 주목받게 되면서[1] 청각 검사를 치매 진단에 활용하고자 하는 일련의 연구들이 활발히 진행되고 있다[2]. 구체적으로, 알츠하이머병(Alzheimer’s disease, AD) 환자에게 청성유발전위(auditory event-related potentials)의 여러 요소들 중 N200과 P300 측정 파형의 잠복기(latency)와 P300 반응의 진폭(amplitude)을 분석한 결과들을 바탕으로 메타 분석을 실시한 연구에서는 정상 인지 기능의 대조군과 비교 시 AD 환자의 N200과 P300 잠복기가 유의하게 지연되었고[3,4] P300의 진폭은 유의하게 감소하였다[5]. 이러한 선행 연구들은 임상 적용을 위한 기초적 자료제공은 가능하지만, 대부분의 개별 연구에서 한계점으로 보고하였듯이 특정 요소의 측정 반응에만 초점을 두어 아쉽게도 청각적 정보처리 및 인지 과정을 종합적으로 파악하지 못하였다[6]. 즉, 청각 기관을 통한 선택적 주의력(selective attention)과 관련 있는 N100, 소리의 음향적 특성 분석의 기초 능력(elementary feature analysis)과 연관된 N200, 청각 정보 처리 및 청각적 인지 기능을 측정하는 P300 등 여러 요소들의 결과들을 근거로 중추청각기관의 경로를 전반적으로 확인하고 치매 환자들의 청각 처리 능력을 종합적으로 이해할 필요가 있다[7].
대표적으로 알려진 퇴행성 뇌 질환은 AD, 파킨슨병(Parkinson’s disease, PD), 루이소체치매(dementia with Lewy bodies, DLB), 파킨슨병치매(Parkinson’s disease dementia, PDD) 등으로, 공통적으로 변형된 단백질의 비정상적 침착으로 인한 변형단백질환(proteinopathy)을 특징으로 한다. 그러나 퇴행성 뇌질환으로 인한 치매는 한 종류의 변형 단백질로 야기된 문제보다는 여러 변형 단백질들의 복합적인 영향을 받게 되기에, 유형이 다른 치매들 간에도 증상이 비슷하게 나타나는 경우가 흔하다[8]. 예를 들어, 사후 부검 연구에서는 일부 DLB 환자에서 베타-아밀로이드가 검출되기도 하고, 역으로 후기 AD 환자에서는 알파-시누클레인의 변형된 형태인 루이소체(Lewy body, LB)가 관찰되기도 한다[9]. 특히, AD, DLB, PDD는 그 형태가 많이 중복되기에 진단에 어려움이 있으며, 이들의 관계를 밝히기 위한 연구가 계속해서 진행되고 있다[8]. 1995년에 DLB는 AD와 PDD로 부터 임상병리학적으로 구분이 되었으나, 2014년까지도 DLB를 다른 유형의 치매로 오진하는 경우가 많아 최근에도 계속해서 진단 기준이 수정되고 있다[10].
Hardy 등[11]은 치매의 유형에 따른 피질의 구조적 또는 위치적 손상이 청각 기능 저하에 정도의 차별적 영향을 줄 수 있다고 보고하였다. 즉, 치매는 청각 기능이 비교적 잘 보존되는 유형이 있는 반면, 심각한 청각 기능 손상을 보이는 치매의 유형이 있다. 청각적 기능 손상과 관련된 뇌 네트워크의 병리학적 위치를 구분해보면, AD 환자의 경우 후측대상피질(posterior cingulate cortex), 쐐기앞소엽(precuneus), 측두두정부(temporo-parietal cortices)로[11], 해당 위치의 손상은 복잡한 음향 환경에서 음원의 위치를 파악하는 능력이 저하되며[12] 청각장면분석(auditory scene analysis)이 어려워지고[13] 소리에 대한 민감도가 증가하게 된다[14]. 반면, DLB와 PDD의 의병리학적 위치는 피질-피질하 회로(cortico-subcortical circuits)로써 해당 부위의 손상은 청각적 자극에 대한 탐지 및 분석이 어렵고 청각장면분석 능력이 저하되어[15,16] 궁극적으로는 청각적 주의력과 작업 기억력에 부정적 영향을 끼치게 된다[17]. 이러한 다양한 치매 유형들의 청각 기능의 차이에 따라 청각 검사를 환자들에게 적용하여 그 유형을 세분화하고자 하는 연구들이 시도되고 있으나[18-20], 실제 임상 현장의 적용까지는 많은 검증이 필요한 상황이다.
치매 환자의 청각 검사 결과들을 바탕으로 실시한 기존의 메타 분석 연구는 다음과 같은 한계점을 갖는다. 청성유발전위 검사들 중 특정 요소만의 메타 분석 결과를 제공했고, 1995년 이전 문헌을 포함하여 치매 유형에 따른 연구 대상자를 구분하지 못하였을 가능성이 높고, 치매 환자의 주관적 측정 결과에 대한 메타 분석 문헌의 부재 등이다. 따라서 본 종설 논문에서는 비교적 비슷한 증상으로 진단이 까다로운 AD, DLB, PDD 환자들에게 객관적 및 주관적으로 실시한 청각 검사들을 적용한 문헌들을 검색하고 세분화하여 분류한 후 메타 분석을 실시하여 현재 치매 환자들의 청각 결과들을 종합적으로 정리하고자 한다.

본 론

체계적 문헌 검색의 전략과 선정

문헌 선정, 데이터 추출과 분석, 문헌의 포함과 제외 방법은 Participants, Index test, Control, Outcomes, Study design (PICOS) 기준을 적용하였다[21]. 즉, 문헌은 PICOS 기준에 의거하여 선정 및 분류되었으며, 구체적인 체계적 문헌 고찰의 과정은 PRISMA 2015 Flow Diagram을 참고하여 작성하였다[22]. 체계적 문헌 고찰의 모든 과정은 두 명의 저자에 의해 독립적으로 평가되었다. 추출된 데이터 및 문헌이 두 저자에 의해 합의가 이루어지지 않은 경우에는 문헌을 재검토하여 논의하였다. 본 연구에 적용한 PICOS 기준은 Table 1에 기술하였다.

문헌 발견(Identification)

본 종설에서는 AD, DLB, PDD 환자군을 대상으로 청각 검사를 적용한 연구만을 선정하고 수집하였다. 연구 목적에 따른 구체적인 문헌 선정을 위해, 7개의 전문 학술 전자 데이터베이스인 Pubmed, Embase, Medline, Web of science, SciELO, Scopus, Cochrane Library에서 문헌을 검색하였다. 검색어는 의학주제명표목(Medical Subject Headings, MeSH) 용어 및 선행 문헌에서 자주 표현된 용어에서 확인하였다: ‘Alzheimer disease(AD)’ OR ‘Parkinson’s disease Dementia (PDD)’ OR ‘Dementia with Lewy bodies(DLB)’ OR ‘Proteinopathy’ OR ‘Lewy’ OR ‘Dementia’ OR ‘Alzheimer’ AND ‘Auditory function’ OR ‘Biomarker’ OR ‘Auditory perception’ OR ‘Speech perception’ OR ‘Electroencephalography (EEG)’ OR ‘Speech recognition’ OR ‘Evoked potential’ OR ‘Event-related potential’ OR ‘Electrophysiology’ OR ‘Auditory stimulation’ OR ‘Behavioral’ OR ‘Objective’ AND ‘Pure tone audiometry(PTA)’ OR ‘Mismatch negativity (MMN)’ OR ‘P300(P3)’ OR ‘N100(N1)’ OR ‘N200(N2)’ OR ‘P100(P1)’ OR ‘N400(N4)’ OR ‘Auditory brainstem response (ABR)’ OR ‘Otoacoustic emission(OAE)’ OR ‘Auditory steady-state response(ASSR)’ OR ‘Auditory middle latency response(AMLR)’.
출간기간에 따른 문헌들의 선정기준은 The Consortium on Dementia with Lewy bodies에서 DLB의 진단기준을 설정하고 별개의 임상 증후군으로 인정되어 DLB가 AD 및 PDD와의 임상 병리학적 분리가 구체화된 1995년 1월을 기점으로 하였다[23]. 즉, 1995년 1월~2020년 5월까지의 문헌이 본 논문에 포함되었다. 본 종설에서는 연구논문만을 포함하여 서적, 종설, 학회 초록, 메타 분석 연구는 제외되었으며, 경도인지장애 및 동물 연구 또한 제외시켰다.

문헌 선별(Screening)

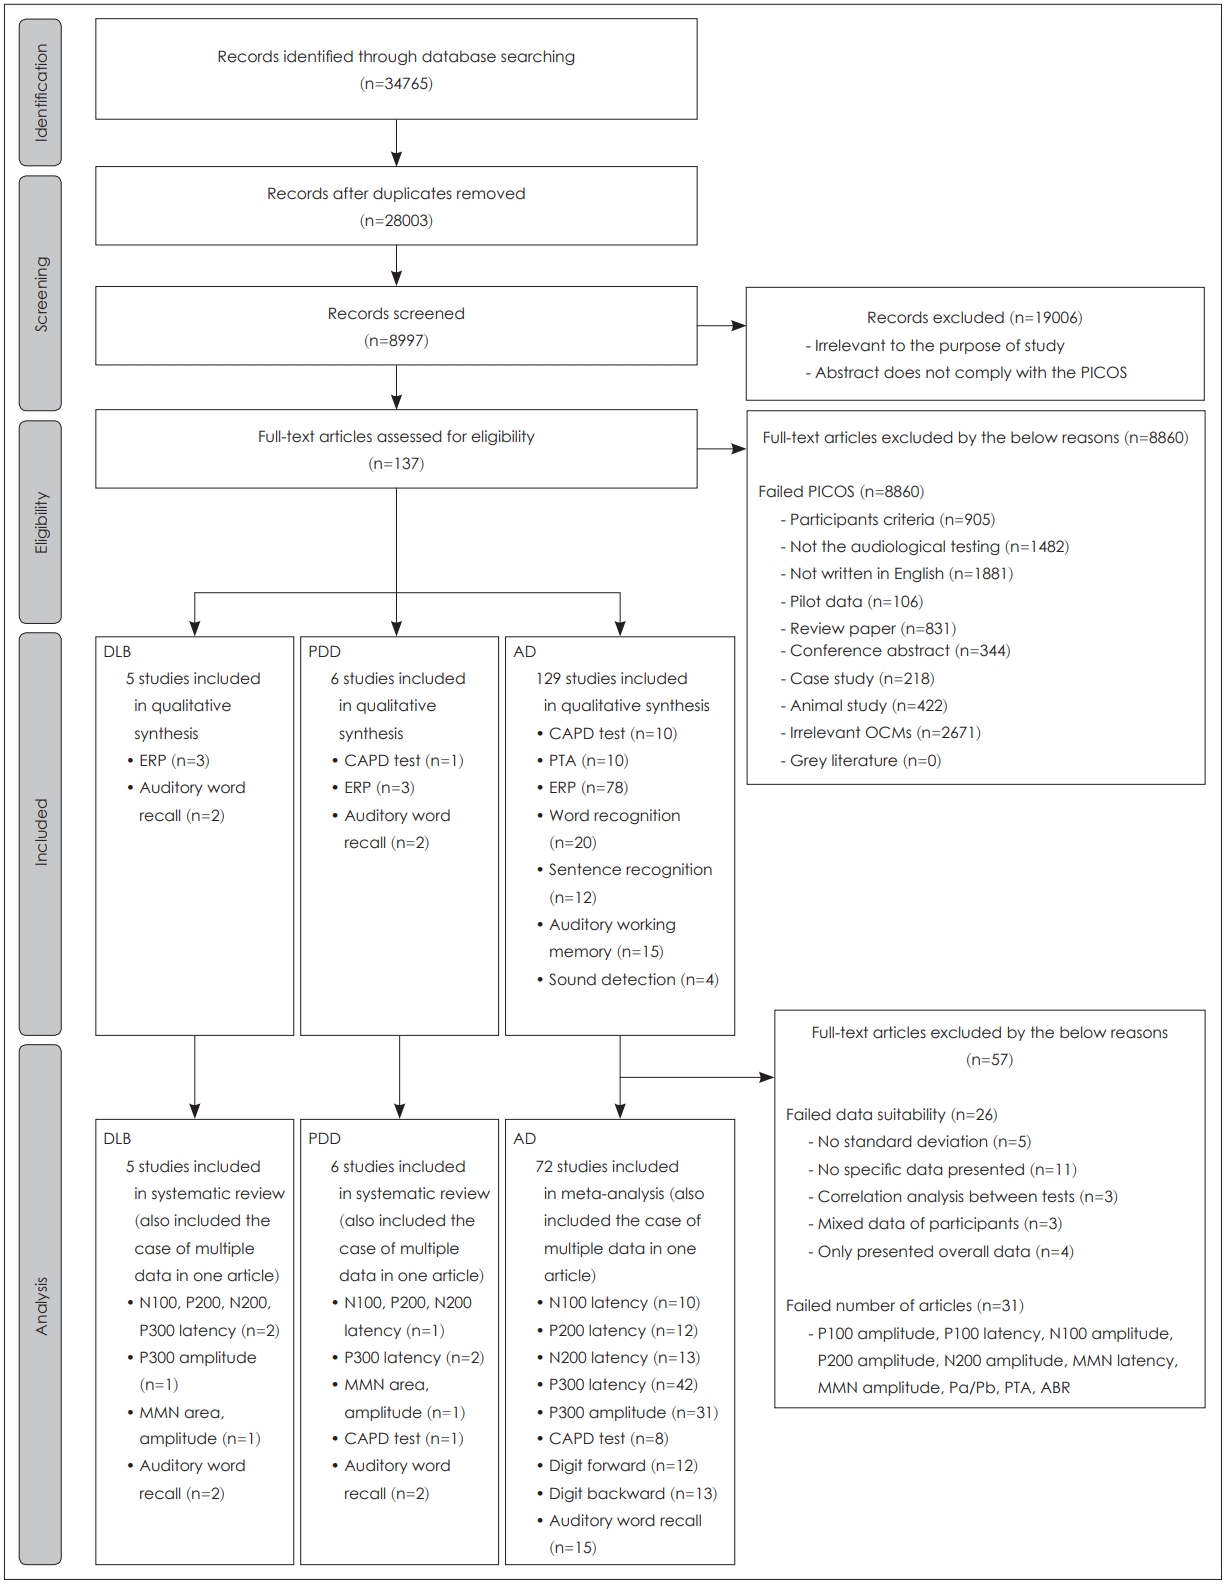
7개의 전문 학술 전자 데이터베이스를 사용하여 34765개의 문헌이 검색되어 스크리닝 단계에 포함되었다(Fig. 1, Identification level). 그 중 중복되는 문헌(n=6762)을 제거하여 28003개의 문헌이 선별되었고, 문헌의 초록을 PICOS 기준에 의거하여 두 명의 저자에 의해 독립적으로 검토되었다. 결과적으로 19006개의 문헌이 제거되어 총 8997개의 문헌이 선정기준 평가 단계에 포함되었다(Fig. 1, Screening level). 즉, 선정기준 평가 단계에 포함된 문헌들은 PICOS 기준을 충족하거나, 초록의 내용만으로는 평가하기 어려운 경우를 모두 포함하였다.

선정 기준(Eligibility)의 검토 및 최종 선정(Inclusion)

다양한 이유로 PICOS 기준을 충족하지 못한 8860개의 문헌이 제거되어, 결과적으로 137개의 문헌이 선정기준에 만족하였다(Fig. 1, Eligibility level). 그 중 129개의 문헌이 AD 환자군을 포함하였으며, DLB와 PDD 환자군을 포함한 문헌은 각각 5개와 6개였다(Fig. 1, Included level). 해당 문헌에서 주로 사용된 청각 검사들은 청성유발전위 검사, 중추청각검사, 청각단어회상검사, 순음청력검사, 단어인지검사, 문장인지검사 등이다.
AD 환자군을 포함한 개별 문헌에서 데이터를 추출하는 과정 중 표준편차 데이터 누락(5/26), 구체적인 수치의 누락(11/26), 검사 도구간의 상관 분석 결과만을 제시하여 고유의 데이터 확인이 불가(3/26), 연구대상자 간의 혼재된 결과 제시(3/26), 전체적인 데이터만을 제시한(4/26), 총 26개의 문헌이 추가적으로 제거되었다. 데이터의 추출 과정에서 선정기준을 만족하였으나, 포함된 문헌 수가 6개 이하로 매우 적어 메타 분석에 포함되지 못한 검사는 P100 진폭, P100 잠복기, N100 진폭, P200 진폭, N200 진폭, mismatch negativity (MMN) 잠복기, MMN 진폭, Pa/Pb, puretone audiometry (PTA), auditory brainstem response(ABR)였으며, 총 31건의 문헌이 이에 포함되었다. 따라서, 메타 분석을 실시하기 위해 최종 72개의 문헌이 포함되었다(Fig. 1, Analysis level).

AD 환자의 청각 기능에 관한 메타 분석

메타 분석에 사용된 문헌은 AD 환자의 청각 검사 결과, 실험군과 동일 연령의 대조군 결과, 적절한 결과 측정 데이터를 모두 포함하였다. 효과 크기의 계산은 실험군과 대조군의 평균, 표준편차, 연구대상자의 수를 사용하였고, 청성유발전위 반응 및 청각적 수행력을 확인한 실험 결과임에도 대부분의 연구는 검사 설정 및 검사 도구의 다양성으로 인해 표준화된 평균 차이(standardized mean difference, SMD)로 효과 크기가 계산되었다[24]. 모든 효과 크기는 95%의 신뢰구간을 갖는 확률효과모델(random effect model)을 사용하였으며, 하위군 분석은 하위군 간의 혼합 효과 Q검정을 사용하여 효과 크기를 비교하였다[25]. 하나의 문헌에서 여러개의 데이터가 추출될 경우 각각의 데이터는 개별적인 데이터로 간주하여 분석을 실시하였다. 예를들어, 하나의 문헌에서 특정 요소의 반응을 다양한 전극위치에서 확인할 때 각각의 결과는 개별 데이터로 간주된다. 전극위치는 같지만 자극음에 따른 반응을 측정한 경우에도 자극음에 따른 각각의 반응 결과가 개별 데이터로 간주된다. 깔때기 도표(funnel plot)와 Egger’s 회귀 비대칭 분석은 출판편향(publication bias)을 확인하기 위해 사용되었다[26]. 메타 분석을 위해 Comprehensive MetaAnalysis (Ver. 3, Biostat Inc., Englewood, NJ, USA) 프로그램을 사용하였다.
본 메타 분석에 사용된 72개의 문헌들의 데이터를 바탕으로 Fig. 2를 제작하여 AD 환자군과 대조군의 각 검사별 차이값을 가시화하였다. 메타 분석 및 Egger’s 회귀 비대칭 분석의 결과는 Table 2에 정리하였다. 대부분의 메타 분석 결과에서 높은 이질성(I2≥75%)이 확인되어 청성유발전위 검사는 측정 전극과 자극음의 종류를 구분하여 하위군 분석을 실시하였다. 또한, 주관적 청각검사에서는 검사 도구의 종류, 검사의 특성을 고려하여 지연시간, 측정한 귀에 대해 하위군 분석을 실시하였다. 메타 분석의 숲 그림(forest plot)은 부록(Appendix 1, 2, and 3)에 제시하였다.

객관적 청성유발전위 검사

N100 latency

N100 잠복기의 메타 분석은 12개의 문헌에서 총 15개의 데이터로 실시하였다. 15개의 데이터 평균은 다른 측정 요소들과 함께 Fig. 2A에 제시하였다(AD mean: 107.15±10.74 ms, control mean: 107.00±14.59 ms). AD 환자군과 대조군의 N100 잠복기를 비교한 메타 분석 결과는 유의한 차이를 보이지 않았으며[SMD=0.672, 95% confidence interval(CI)=-0.051 to 1.395, p=0.069], 높은 이질성이 확인되었다(I2=94.15%). Egger’s 회귀 비대칭 분석시 출판편향이 존재함을 확인하였다[intercept=12.199, standard error(SE)=3.047, p<0.001]. 높은 이질성으로 인해 측정 전극에 대해 하위군 분석을 실시하였으나, 자극음의 종류는 포함된 15개의 데이터가 1000 Hz의 배경음, 2000 Hz의 목표음으로 동일하여 하위군 분석을 실시하지 않았다.
전극 위치에 따른 하위군 분석 후에도, 여전히 높은 이질성이 관찰되었다(SMD=1.973, 95% CI=0.626 to 3.321, p=0.004; I2=93.37%). 하위군 분석에 포함된 15개 데이터의 전극 위치(데이터수)는 Cz(8/15), Fz(2/15), Oz(1/15), Pz(4/15)였고, 주요 전극 위치의 효과 크기는 Oz(SMD=4.366, 95% CI=1.799 to 6.933, p<0.001), Fz(SMD=2.621, 95% CI=0.845 to 4.397, p=0.004), Pz(SMD=1.366, 95% CI=0.136 to 2.596, p=0.030), Cz(SMD=0.885, 95% CI=0.012 to 1.759, p=0.047)의 순으로 확인되어 Oz 위치에서 AD 환자군과 대조군의 N100의 잠복기 차이가 상대적으로 가장 컸다.

P200 latency

P200 잠복기에 관한 메타 분석은 10개의 문헌에서 총 15개의 데이터를 추출하여 수행하였다. 포함된 15개의 데이터 평균은 Fig. 2A에 제시하였다(AD mean: 200.19±15.99 ms, control mean: 187.43±12.21 ms). Egger’s 회귀 비대칭 분석 결과에서 출판편향이 존재하지 않았지만(intercept=-0.678, SE=2.423, p=0.392), 종합적인 메타 분석의 결과는 유의한 차이를 확인할 수 없었고(SMD=0.129, 95% CI=-0.131 to 0.389, p=0.331), 중간크기의 이질성이 확인되어(I2=61.33%) 하위군 분석을 측정 전극 및 자극음의 종류에 대해 실시하였다.
하위군 분석에 포함된 15개의 전극 위치(데이터수)는 C5(1/15), C6(1/15), Cz(8/15), Fz(1/15), Pz(4/15)였으며, 자극 음의 종류는 1000/2000(12/15)와 250/4000(2/15)의 배경음/목표음(데이터수), 800 Hz 단일 자극음(1/15)이었다. 전극 위치에 따른 하위군 분석의 결과로 어느 정도 이질성이 해결되었으나, 여전히 중간크기의 이질성이 확인되었다(SMD=0.134, 95% CI=-0.173 to 0.440, p=0.394; I2=55.69%). 하위군 분석 으로 확인된 효과 크기는 C5(SMD=4.366, 95% CI=-0.529 to 1.396, p=0.377), Pz(SMD=0.307, 95% CI=-0.160 to 0.775, p=0.197), Fz(SMD=0.214, 95% CI=-0.775 to 1.203, p=0.671), Cz(SMD=0.015, 95% CI=-0.336 to 0.365, p=0.935), C6(SMD=-0.253, 95% CI=-1.212 to 0.707, p<0.001)의 측정 전극 순이였다. C5 위치에서 P200의 잠복기 차이가 비교적 컸으나 통계적으로 유의한 차이를 보여주지는 않았다. 또한, 해당 위치에서 측정된 데이터의 개수는 1개로 다른 전극 위치와의 직접적인 효과크기 비교가 어려웠다.
자극음에 따른 하위군 분석 또한 이질성이 어느 정도 해결이 되었으나, 중간 크기의 이질성이 확인되었다(SMD=0.069, 95% CI=-0.285 to 0.424, p=0.702; I2=55.69%). 1000/2000 Hz 집단에서 가장 큰 효과 크기를 보였으며(SMD=0.185, 95% CI=-0.081 to 0.452, p=0.173), 그 다음으로 250/4000 Hz의 자극음 집단(SMD=0.089, 95% CI=-0.549 to 0.728, p=0.784), 800 Hz 단일 자극음 집단 순으로 확인되었으나 모두 통계적으로 유의하지 않았다(SMD=-0.415, 95% CI=-1.234 to 0.403, p=0.320).

N200 latency

N200 잠복기의 메타 분석은 13개의 문헌에서 총 16개의 데이터를 추출 후 실시하였다. 추출된 16개의 데이터의 평균은 Fig. 2A에 제시되었다(AD mean: 283.05±31.66 ms, control mean: 246.85±20.45 ms). Egger’s 회귀 비대칭 분석에서 출판편향이 나타났다(intercept=6.772, SE=2.586, p=0.010). 전반적으로 N200 잠복기에 유의한 차이를 보였으나(SMD=1.144, 95% CI=0.475 to 1.813, p<0.001), 높은 이질성으로 인해 전극 위치에 따른 반응의 잠복기를 하위군 분석으로 실시하였다(I2=92.73%). 포함된 16개의 데이터는 모두 배경음 1000 Hz, 목표음 2000 Hz을 사용하였다.
하위군 분석에 사용된 16개의 데이터(데이터수)는 Cz(9/16), Pz(2/16), Fz(5/16)의 전극위치에서 측정되었으며, 하위군 분석을 진행하였음에도 높은 이질성이 확인되었다(SMD=1.930, 95% CI=0.594 to 3.267, p=0.005; I2=90.97%). 각 하위군의 효과 크기는 Fz(SMD=3.281, 95% CI=1.539 to 5.023, p<0.001), Pz(SMD= 2.084, 95% CI=1.027 to 3.141, p<0.001), Cz(SMD=0.911, 95% CI=0.131 to 1.691, p=0.022)의 순으로 나타나, Fz 위치에서 측정한 N200의 잠복기가 AD 환자군과 대조군 간의 차이를 명확하게 보여주는 것으로 확인되었다.

P300 latency

P300 잠복기의 메타 분석은 42개의 문헌이 포함되었으며, 총 69개의 데이터가 사용되었다. 포함된 69개의 데이터 평균은 다른 측정 요소와 함께 Fig. 2A에 제시하였다(AD mean: 410.22±40.80 ms, control mean: 366.46±25.98 ms). P300 잠복기의 메타 분석 결과에서는 유의한 차이가 확인되었지만(SMD=1.220, 95% CI=0.936 to 1.504, p<0.001), 이질성 또한 높게 확인되었다(I2=91.50%). 출판편향도 존재하였기에(intercept=6.089, SE=1.067, p<0.001), 자극음 종류와 전극 위치에 따른 하위군 분석을 진행하였다.
하위군 분석을 실시하여 어느 정도 이질성이 해결되었지만, 이질성은 여전히 높았다[전극위치: (SMD=1.315, 95% CI=0.758 to 1.872, p<0.001; I2=86.52%), 자극음: (SMD=0.960, 95% CI=0.261 to 1.659, p=0.007; I2= 86.52%)]. 전극 위치에 따른 하위군 분석에 포함된 69개의 데이터 중에서 문헌에서 주로 사용된 전극(데이터수)인 Cz(26/69), Fz(15/69), Pz(25/69)의 결과를 바탕으로 비교하였다. 전극 위치에 따른 효과 크기는 Pz(SMD=1.332, 95% CI=0.974 to 1.690, p<0.001), Fz(SMD=1.096, 95% CI=0.745 to 1.446, p<0.001), Cz(SMD=1.332, 95% CI=0.974 to 1.690, p<0.001) 순으로 나타나 Pz의 전극 위치에서 AD 환자군과 대조군 간의 P300 잠복기의 차이가 가장 크게 확인되었다.
자극음에 따른 하위군 분석에 포함된 데이터의 자극음 종류(데이터수)는 1000/2000 Hz(57/69), 1601/402 Hz(1/69), 250/4000 Hz(1/69), 500/1000 Hz(3/69), 750/2000 Hz(3/69), 980/1970 Hz(1/69), 숫자(1/69), 자극음 데이터 없음(2/69)으로 다양했다. 각 자극음 하위 그룹의 효과 크기는 다음과 같다: 1000/2000 Hz(SMD=1.334, 95% CI=1.089 to 1.580, p<0.001), 1601/402 Hz(SMD=0.450, 95% CI=-1.479 to 2.380, p=0.647), 250/4000 Hz(SMD=0.887, 95% CI=-0.916 to 2.690, p=0.335), 500/1000 Hz(SMD=0.410, 95% CI=-0.630 to 1.451, p=0.439), 750/2000 Hz(SMD=1.236, 95% CI=0.210 to 2.263, p=0.018), 980/1970 Hz(SMD=-1.189, 95% CI=-3.106 to 0.728, p=0.224), 숫자(SMD=3.687, 95% CI=1.276 to 6.097, p=0.003), 자극음 데이터 없음(SMD=1.108, 95% CI=-0.162 to 2.378, p=0.087).

P300 amplitude

P300 진폭의 메타 분석은 31개의 문헌에서 총 56개의 데이터가 포함되었다. 56개의 데이터의 평균은 Fig. 2B에 제시하였다. 대조군(8.69±3.54 μV)에 비해 AD 환자군의 P300 진폭평균은 6.39±3.48 μV로 작았다. 메타 분석 결과, P300 진폭의 유의한 차이가 확인되었으나(SMD=-0.595, 95% CI=-0.907 to -0.284, p<0.001) 높은 이질성이 확인되었고(I2=91.63%), 출판편향 또한 존재하였다(intercept=-6.934, SE=1.576, p<0.001). P300의 진폭 역시 높은 이질성으로 인해 전극 위치와 자극음의 하위군 분석을 실시하였다.
하위군 분석 실시 후에도 여전히 높은 이질성이 관찰되었다[전극위치: (SMD=-1.036, 95% CI=-1.594 to -0.477, p<0.001; I2=88.15%), 자극음: (SMD=-0.844, 95% CI=-1.526 to-0.162, p=0.015; I2=88.15%)]. 전극 위치에 따른 하위군 분석으로 C3(SMD=-2.922, 95% CI=-5.025 to -0.819, p=0.006), C4(SMD=-2.658, 95% CI=-4.733 to -0.584, p=0.012), FCz(SMD=-0.468, 95% CI=-2.423 to 1.486, p=0.639), Oz(SMD=-2.733, 95% CI=-4.648 to -0.818, p=0.005)는 각각 한 개의 데이터만이 추출되어 분석되었음으로 직접적인 비교가 어려웠다. 따라서, 전극 위치(데이터수)는 Cz(19/56), Fz(12/56), Pz(21/56)의 결과가 비교되었다. 전극 위치에 따른 효과 크기는 Cz(SMD=-0.698, 95% CI=-1.135 to -0.261, p=0.002), Pz(SMD=-0.696, 95% CI=-1.110 to -0.283, p<0.001), Fz(SMD=-0.593, 95% CI=-1.139 to -0.047, p=0.033)의 순으로 확인되어, Cz의 전극 위치에서 AD 환자군과 대조군 간의 P300 진폭의 차이가 가장 크게 나타났다.
자극음 하위군 분석에 포함된 데이터(데이터수)는 1000/2000 Hz(43/56), 250/4000 Hz(1/56), 500/1000 Hz(2/56), 750/2000 Hz(3/56), 800/1200 Hz(3/56), 980/1970 Hz(1/56), 자극음 데이터 없음(3/56)이었다. 하위군 분석의 효과 크기 결과는 1000/2000 Hz(SMD=-0.736, 95% CI=-1.036 to-0.436, p<0.001), 250/4000 Hz(SMD=-0.240, 95% CI=-2.166 to 1.686, p=0.807), 500/1000 Hz(SMD=-0.633, 95% CI=-2.010 to 0.745, p=0.368), 750/2000 Hz(SMD=-0.217, 95% CI=-1.315 to 0.881, p=0.699), 800/1200 Hz(SMD=-2.722, 95% CI=-3.957 to -1.487, p<0.001), 980/1970 Hz(SMD=-0.468, 95% CI=-2.484 to 1.548, p=0.649), 자극음 데이터 없음(SMD=-0.636, 95% CI=-1.748 to 0.476, p=0.262) 이었다.

주관적 중추청각행동검사

중추청각장애검사 배터리

중추청각장애검사는 8개의 문헌이 포함되어 총 20개의 데이터가 메타 분석에 사용되었다. 20개의 데이터 평균은 Fig. 2C에 제시하였다(AD mean: 61.20±20.15%, control mean: 90.03±10.41%). 흥미롭게도, Fig. 2D에서는 AD 환자군의 우측 귀 수행력이 66.36±19.78%였으며, 대조군은 90.49±11.58%의 수행력을 보였다. 좌측 귀 수행력의 평균은 AD 환자군이 55.39±22.46%였고, 대조군은 91.15±10.32%로, AD 환자군은 좌측 귀 수행력이 우측귀에 비해 약 10% 낮았다. 양측 귀의 수행력 평균은 AD 환자군이 58.70±10.60%, 대조군이 83.30±1.41%로 확인되었다.
메타 분석 결과에서 유의한 차이가 확인되었으며(SMD=-1.299, 95% CI=-1.512 to -1.086, p<0.001), 이질성도 낮았다(I2=13.49%). 출판편향은 존재하는 것으로 확인되었다(intercept=-3.461, SE=0.700, p<0.001). 메타 분석에 포함된 데이터(데이터수)의 검사는 이분숫자청취(dichotic digits)(6/20), 이분문장청취(dichotic sentence)(2/20), 음장단패턴(duration pattern)(1/20), 주파수패턴(pitch pattern)(1/20), Synthetic Sentence Identification message-to-competition ratios(SSI/MCR) +10(2/20), SSI/MCR 0(2/20), SSI/MCR -10(2/20), SSI/MCR -20(2/20), Synthetic Sentence Identification test with contralateral competing message(1/20), Synthetic Sentence Identification test with ipsilateral competing message(1/20)이 포함되었으며, 수행력을 측정한 귀(데이터수)는 양측(2/20), 좌측(8/20), 우측(10/20)이었다.

숫자 폭(Digit span) 검사

숫자 바로 따라하기(digit span forward)의 메타 분석에 포함된 문헌은 12개였다. 포함된 12개의 데이터 평균은 AD 환자군이 6.09±0.52였고, 대조군이 7.08±0.80이었다(Fig. 2E). 숫자 바로 따라하기의 메타 분석 결과에서 유의한 차이가 확인되었고(SMD=-0.659, 95% CI=-0.918 to -0.399, p<0.001), 중간크기의 이질성이 확인되었다(I2=42.59%). 한편, 출판편향은 존재하지 않는 것으로 확인되었다(intercept=-2.997, SE=2.715, p=0.148). 하위군 분석은 검사 종류에 대해 실시되었으며, 검사 종류(데이터수)는 웩슬러 지능 검사(Wechsler Adult Intelligence Scale-Revised, WAIS-R)(6/12)의 정량화된 결과와 최대 숫자 수행력(6/12)이 하위군으로 포함되었다.
검사 종류에 따른 하위군 분석 결과는 포함된 문헌의 숫자 바로 따라하기 수행력에서 각각 한 개씩의 데이터만 보고되어 이질성 결과는 동일하였다(SMD=-0.660, 95% CI=-0.926 to -0.394, p<0.001; I2=42.59%). 하위군의 개별적인 결과에서 효과 크기의 차이는 상대적으로 WAIS-R이 높았으며(SMD=-0.747, 95% CI=-1.135 to -0.358, p<0.001), 상당히 낮은 이질성을 보였다(I2=2.53%). 반면, 최대 숫자 수행력은 높은 이질성을 보였다(SMD=-0.583, 95% CI=-0.949 to -0.218, p=0.002; I2=61.96%).
숫자 거꾸로 따라하기(digit span backward)의 메타 분석에 포함된 문헌은 13개이다. 포함된 13개 데이터의 평균은 AD 환자군이 4.06±0.59, 대조군이 5.37±0.72였다(Fig. 2E). 출판편향은 없는 것으로 확인되었으며(intercept=-4.315, SE=2.510, p=0.057), 메타 분석 결과는 유의한 차이가 확인되었고 중간크기의 이질성이 확인되었다(SMD=-0.901, 95% CI=-1.179 to -0.624, p<0.001; I2=51.71%). 검사종류(데이터수)에 따른 하위군 분석을 위해 WAIS-R(6/13), 최대 숫자 수행력(7/13)이 하위군으로 포함되었다. 하위군 분석의 이질성은 숫자 바로 따라하기와 동일하였다(SMD=-0.904, 95% CI=-1.190 to -0.617, p<0.001; I2=51.71%). 분석 결과, WAIS-R의 효과 크기가 최대 숫자 수행력을 확인한 효과 크기보다 상대적으로 더 크게 나타났다[WAIS-R: (SMD=-0.983, 95% CI=-1.419 to -0.548, p<0.001; I2=42.01%), 최대 숫자 수행력: (SMD=-0.843, 95% CI=-1.223 to -0.462, p<0.001; I2=61.65%)].

청각 단어 회상(Auditory word recall) 검사

청각 단어 회상 검사의 메타 분석은 15개의 문헌에서 총 23개의 데이터가 포함되었다. 추출된 23개의 데이터 평균은 AD 환자군이 3.52±6.70이었으며, 대조군은 9.06±8.08를 보였다(Fig. 2F). 메타 분석 결과, 청각 단어 회상과제의 유의한 차이가 확인되었으나(SMD=-2.308, 95% CI=-2.767 to -1.848, p<0.001) 높은 이질성이 확인되었으며(I2=95.87%), 출판편향 또한 존재하였다(intercept=2.671, SE=1.538, p<0.048). 높은 이질성으로 인해 회상에 대한 지연시간과 검사도구의 하위군 분석을 실시하였다.
하위군 분석을 실시하여 이질성이 일부 해결되었지만, 여전히 이질성은 높게 나타났다[회상에 대한 지연시간: (SMD=-2.267, 95% CI=-3.264 to -1.269, p<0.001; I2=91.96%), 검사도구: (SMD=-1.880, 95% CI=-2.911 to -0.850, p<0.001;I2=91.96%)]. 회상에 대한 지연시간(데이터수)에 따른 하위군 분석으로 하위군은 구체적인 시간을 기재하지 않은 지연회상(8/23), 즉시회상(3/23), 장기지연회상(6/23), 단기지연회상(6/23)의 총 23개의 데이터가 포함된 4개의 군으로 나뉘었다. 개별 집단의 효과 크기는 장기지연회상(SMD=-3.277, 95% CI=-3.717 to -2.837, p<0.001), 단기지연회상(SMD=-3.257, 95% CI=-3.697 to -2.818, p<0.001), 지연회상(SMD=-2.296, 95% CI=-2.745 to -1.846, p<0.001), 즉시회상(SMD=-0.222, 95% CI=-0.973 to 0.529, p=0.563)순으로 확인되었다.
하위군 분석에 포함된 검사도구의 종류(데이터수)는 캘리포니아 언어 학습 검사(California Verbal Learning Test, CVLT) (5/23), 레이 청각 언어 학습 검사(Rey Auditory Verbal Learning Test, RAVLT)(2/23), 청각 언어 학습검사(Auditory-Verbal Learning Test, AVLT)(11/23), 필라델피아 언어 학습 검사(Philadelphia Verbal Learning Test, PVLT)(1/23), 웩슬러지능 검사(2/23), Battery of Cognitive Assessment Instruments developed by World Health Organization(WHOBCAI)(2/23)이었다. 각 검사에 대한 효과 크기는 청각 언어 학습검사(SMD=-2.953, 95% CI=-3.216 to -2.691, p<0.001), 캘리포니아 언어 학습 검사(SMD=-3.451, 95% CI=-3.927 to -2.975, p<0.001), 필라델피아 언어 학습 검사(SMD=3.381, 95% CI=2.068 to 4.694, p<0.001), 레이 청각 언어 학습검사(SMD=-1.884, 95% CI=-2.645 to -1.123, p<0.001), 웩슬러지능 검사(SMD=-1.511, 95% CI=-2.281 to -0.741, p<0.001), WHO-BCAI(SMD=-2.299, 95% CI=-2.951 to -1.646, p<0.001)로 확인되었다.

DLB 환자의 청각 기능을 위한 체계적 연구 결과 분석

DLB 환자들을 대상으로 청각 검사를 실시한 문헌은 대상자가 중복된 문헌을 포함하여 5개로 확인되었다. 문헌의 수의 부족과 검사 도구의 이질성으로 인해 메타 분석의 실시가 불가능하여 체계적 연구 결과 분석을 실시하였고 해당 문헌에 대한 자세한 내용은 Table 3에 요약하여 정리하였다.

객관적 청각유발전위 검사

Bonanni 등[18]은 초기 AD 환자와 DLB 환자의 차이를 청성후기반응(N100, P200, N200, P300)을 통해 확인하였다. 연구 대상자로는 AD와 DLB 환자군과 정상 인지를 지닌 노인 대조군이 포함되었다. 연구의 결과는 N100과 P200간의 잠복기, 진폭간의 차이는 확인할 수 없었고, N200과 P300간의 잠복기는 세개의 집단간 유의미한 상관관계가 나타났다(r=0.6~0.7). 대조군의 결과를 기준으로 적용한 P300의 상대적 잠복기의 지연비율은 Fz와 Cz위치에서 DLB환자 비율이 AD 환자 비율보다 높았으며, 통계적으로 유의한 결과를 보였다[(Fz=AD: 55%, DLB: 92%, p<0.01), (Cz=AD: 49%, DLB: 85%, p<0.01)]. 전두부에서 후두부로의 진폭 분포 변화(AD=3%, DLB=77%, p<0.001)와 후두부에서 전두부로의 진폭 분포 변화(AD=36%, DLB=0%, p<0.01)도 통계적으로 유의한 결과를 보였다. 대조군과 AD 환자군의 P300 반응의 진폭은 Pz에서 먼저 확인되는 반면, DLB 환자군은 Fz 위치에서 P300 반응의 진폭이 우선적으로 관찰되었다. DLB 환자의 P300 반응을 확인한 Kurita 등[19]의 연구에서도 정상 대조군과의 비교에서 N200과 P300 반응의 잠복기에서 DLB 환자의 잠복기 지연으로 인한 유의한 차이가 확인되었다[(N2 잠복기=정상 대조군: 242.2±37.7, DLB: 284.2±52.2, p<0.01), (P3 잠복기=정상 대조군: 378.8±44.7, DLB: 429.5±87.7, p<0.05)]. 결과를 종합해 보면, P300 잠복기는 AD과 DLB 환자에서 모두 지연되는 결과를 보여주어 절대 잠복기는 정상 대조군과 AD, DLB 환자를 구분하는 지표가 될 수 있으며, 반응의 위치에 따른 잠복기 변화로 AD 환자와 DLB 환자를 구분할 수 있다.
Brønnick 등[17]은 여러 유형의 치매 환자군에게 MMN을 적용하여 청각 자극의 선택적 주의력을 확인하였다. 연구 대상자들은 DLB, PDD, PD, AD, 정상 대조군의 총 5그룹으로 구성되었다. 결과를 요약하면 MMN 반응의 진폭은 PD 환자군에서 가장 크게 관찰되었으며(-3.67±1.24), 뒤이어 DLB(-3.34±1.42), 정상 대조군(-3.14±1.05), AD(-2.59±1.78), PDD(-2.31±0.92)순으로 관찰되어, DLB 환자군과 PDD 환자군 간 MMN 반응 진폭에서 유의한 차이가 관찰되었다(p=0.02). MMN 반응 면적 또한 DLB 환자군(-82.43±50.34)과 PDD 환자군(-29.15±66.04) 간 유의한 차이가 확인되어(p=0.017), 진폭과 면적에서 PDD 환자군이 가장 작은 반응을 나타냈다.

주관적 중추청각행동검사

Maeshima 등[27]은 청각 언어 학습 검사를 사용하여 AD, DLB, 혈관성치매(vascular dementia, VD), 전두측두엽치매(frontotemporal dementia, FTD), 노인 대조군 대상자의 청각 단어 회상 능력을 평가하였다. 결과적으로 즉시회상과 지연회상 검사에서 청각 단어 회상 능력은 대조군과 모든 치매환자군간 유의한 차이가 확인되었다[(즉시회상=AD: 13.9±8.2, VD: 16.2±7.1, FTD: 18.6±8.4, DLB: 15.3±7.1, 노인 대조군: 33.4±7.5, p<0.0001), (지연회상=AD: 0.28±0.92, VD: 0.69±1.56, FTD: 0.50±1.15, DLB: 0±0, 노인 대조군: 4.91±3.34, p<0.0001)]. DLB와 PDD 환자를 대상으로 단어인지 검사를 통해 청각 언어 인지 능력을 확인한 Wesnes 등[20]의 선행 연구에서는 Memantine 약의 효과를 확인하기 위하여 위약군과 실험군으로 PDD 환자와 DLB 환자를 무작위로 할당하여 배치하였다. 그러나, 아쉽게도 해당 문헌에서는 PDD와 DLB 환자의 실제적인 각각의 데이터는 확인할 수 없었다.

PDD 환자의 청각 기능을 위한 체계적 연구결과 분석

대상자가 중복된 문헌을 포함하여 PDD 환자군은 6개의 문헌이 확인되었다. 문헌의 수의 부족과 검사 도구의 이질성으로 인해 DLB 환자군에서와 마찬가지로 메타 분석이 불가능하였다. 따라서 체계적 연구결과분석을 실시 후 Table 4에 결과를 요약하였다.

객관적 청각유발전위 검사

Kurita 등[19]은 AD, DLB, 환시의 증상을 보이는 PDD, 환시의 증상이 없는 PDD 환자군을 대상으로 청성후기반응(N100, P200, N200, P300)을 측정하였다. 환시가 없는 PDD 대상자와 정상 대조군과의 P300의 잠복기에서 유의한 차이가 관찰되었으며(정상 대조군: 378.8±44.7, 환시가 없는 PDD: 445.3±66.1, p<0.01), 환시가 있는 PDD 대상자와 정상 대조군의 N200 잠복기(정상 대조군: 242.2±37.7, 환시가 있는 PDD: 283.2±52.3, p<0.05)와 P300 잠복기(정상 대조군: 378.8±44.7, 환시가 있는 PDD: 436.4±89.3, p<0.05)에도 유의한 차이가 관찰되었다. 앞서 확인한 Brønnick 등[17]의 연구에서도 MMN 반응은 DLB 환자군과 PDD 환자군 간에 진폭(p=0.02)과 면적(p=0.017)에서 유의한 차이가 관찰되었다. Yamamoto 등[28]의 연구에서는 PDD 환자의 P300 반응 잠복기와 MMSE 점수의 상관분석을 실시하였고, PDD 대상자의 P300 잠복기 결과는 MMSE 점수가 17 이상인 경증 치매 환자에서 MMSE 점수와 강한 음의 상관 관계를 보여주었다(r=-0.808; p<0.001).

주관적 중추청각행동검사

주관적 측정방법을 활용하여 PDD 환자군의 청각 능력을 확인한 Claus와 Mohr [29]은 이분청취검사를 실시하였다. 연구 대상자는 AD, 헌팅턴병, PDD, PD, 대조군이 포함되었다. 자유회상 검사의 좌측 귀 수행력에서 PDD 환자군 0.28±0.15의 수행력을 보여 정상 대조군(0.39±0.12, p<0.05)과 파킨슨병 대상자(0.41±0.13, p<0.05)와 유의한 차이를 보였으며, 좌측 귀 회상(left ear recall)검사의 좌측 귀 수행력에서 0.40±0.17의 수행력을 보여 정상 대조군(0.60±0.12, p<0.01)과 PD(0.57±0.16, p<0.05)와 유의한 차이를 보였다. 또한, 우측 귀회상(right ear recall) 검사에서 우측 귀 수행력은 0.44±0.23으로 확인되어 정상 대조군과 유의한 차이를 보였으며(0.64±0.11, p<0.01), 좌측 귀 수행력은 0.28±0.15로 PD와 유의한 차이를 보였다(0.41±0.12, p<0.05). Wesnes 등[20]의 연구에서는 단어 인지 검사를 실시하였지만, PDD 환자만의 순수한 결과는 확인할 수 없었으며, Schmitt 등[30]의 연구에서도 PDD 환자군의 청각 언어인지 검사를 실시하였지만, rivastigmine 약물 복용 및 플라시보 효과에 대한 수행력 변화만을 보고하였다.

결 론

본 종설은 치매 유형에 따른 치매 환자들의 청각 기능을 구분하고자 72건의 AD 환자들의 객관적 청성유발전위 및 주관적 중추청각행동검사의 선행 연구 결과를 바탕으로 메타분석을 실시하였고, DLB 환자군과 PDD 환자군을 대상으로 의미 있는 결과를 보고한 각 5편 및 6편의 논문들의 연구 결과를 체계적으로 분석하였다.
먼저, 청성유발전위 반응의 결과를 기반으로 시행한 메타분석 결과는 AD 환자군과 정상 인지를 갖은 노인 대조군과의 비교에서 N200과 P300 잠복기의 유의한 지연이 관찰되었지만[(N200: SMD=1.144, 95% CI=0.475 to 1.813, p<0.001), (P300: SMD=1.220, 95% CI=0.936 to 1.504, p<0.001)], N100과 P200의 잠복기에서는 유의한 차이가 확인되지 않았다[(N100: SMD=0.672, 95% CI=-0.051 to 1.395, p=0.069), (P200: SMD=0.129, 95% CI=-0.131 to 0.389, p=0.331)]. 이러한 분석은 AD 환자군이 N200의 잠복기부터 순차적으로 유의하게 지연되는 결과를 보여 선행 메타 분석 연구의 결과와 일치성을 나타냈다[3,4]. 또한 P300의 진폭 역시 유의하게 감소된 결과를 나타내 Hedges 등[5]의 메타 분석 결과와 일치하였다. 그러나 선행연구에서도 확인된 높은 이질성은 본 연구에서도 유사하게 확인되었다. Howe 등[4]은 P300 잠복기에 영향을 주는 요인으로 환자군의 평균 연령, 자극 간 간격 및 자극 주파수, 기준 전극, 샘플링 주기를 지적하였고, Hedges 등[5]은 메타 회귀분석을 실시하여 P300 진폭의 결과의 이질성의 원인이 환자군의 교육 수준에 있다고 결론내렸다. 따라서 검사방법, MMSE 점수, 자극의 타입(click/tone), 자극기간, 자극강도, 자극빈도, 평균연령, 교육수준, 기준전극, 자극 주파수, 샘플링주기, 필터 등 다양한 원인들에 의해 청성유발전위의 메타 분석 결과에서 높은 이질성을 보인 것으로 사료되기에 향후 청성유발전위의 검사 셋팅 및 임상적 기준을 보다 명확히 설정하여 일관된 반응을 이끄는 연구들이 필요하다.
주관적 중추청각행동검사에서는 중추청각처리능력, 숫자 바로 따라하기, 숫자 거꾸로 따라하기, 청각 단어 회상 능력에서 유의한 차이가 확인되었다. 또한 중추청각처리검사의 결과가 낮은 이질성과 유의한 수행력의 차이를 보여 임상적 활용 가능성이 높게 판단되었다. 병리학적 위치와 청각적 기능의 연관성을 확인할 때, 대부분은 중추청각처리 과정과 관련이 있음에도 불구하고 중추청각처리능력을 진단할 수 있는 국내의 표준화된 검사가 현재 부재하고 국외에서도 중추청각 처리검사 결과에서 피험자간/피험자내 변이(inter/intra subject variance)가 높기에 실제 임상적 활용은 크지 않다. 그러나 메타 분석에서 의미 있는 결과가 확인된 만큼 향후 치매 환자들을 위한 중추청각처리검사의 적용이 여러 연구에서 시도되어야 하겠다.
한편, DLB 환자와 PDD 환자에게 청각 검사를 적용한 연구들을 체계적으로 결과 분석 시, P300의 잠복기는 DLB와 PDD 환자군 모두 유의하게 지연된 결과를 확인하였고, P300의 진폭 분포 변화는 DLB 환자와 AD 환자, 대조군에서 유의한 차이를 보였다. 또한, PDD 환자군과 DLB 환자군 간에 MMN 진폭 및 면적에서 유의한 차이를 보였다. DLB 환자군은 대조군과의 비교에서 청각 단어 회상 능력의 유의한 차이를 보였으며, PDD 환자군은 이분청취검사에서 우측 귀 수행력이 대조군보다 낮게 나타나 유의한 차이를 보였다.
Table 5는 본 종설 논문에서 다룬 결과들을 종합하여 AD, DLB, PDD 환자군에서 청각 기능의 저하로 확인된 검사들을 표기하였다. DLB와 PDD환자들의 청각적 연구가 매우 적어 본 결과를 일반화하기에는 아직 시기적으로 이르지만, P300 잠복기는 치매의 유형에 상관없이 대조군과 비교 시 모두 유의하게 지연되었다. 따라서 치매의 유무를 확인하기 위한 검사로는 P300 잠복기의 비교를 제안한다. 몇몇 연구에서는 지연된 P300 잠복기의 정도를 통해 치매 유형을 구분하였지만[18], 일부 문헌에서는 지연된 P300 잠복기의 정도가 치매 유형간 유의한 차이를 보이지 않았다[19]. 만약 치매의 유형에 따른 청각 기능의 차이를 구분하고자 한다면, MMN 결과와 P300 진폭 분포 변화를 활용하는 것을 제안한다. 특히 MMN 검사에서는 정상 인지의 대조군과는 통계적 차이가 없었지만, DLB 환자군과 PDD 환자군 간의 비교에서는 유의한 차이를 보여주어 MMN의 진폭 및 면적을 비교하여 치매의 유형 간 차별성을 이끌 수 있을 것으로 사료된다[17].
본 종설의 한계점으로는 아쉽게도 메타 분석 결과에서 높은 이질성이 확인되어 직접적인 임상적 적용은 단언하기 보다는 청성유발전위 검사의 셋팅과 기준에서 클리닉 간 통일성이 필요할 것으로 판단된다. 또한 AD 환자들에 비하여 DLB 및 PDD 환자들을 대상으로 청각적 수행력을 확인한 문헌은 매우 제한적이었다. 따라서 유형별 치매 환자군에게 청각 검사를 적용하고 더 많은 기초 데이터가 축적되어 치매 유형 간 차별화된 청각 선별 도구가 확보될 필요가 있다.

ACKNOWLEDGMENTS

This work was supported by the National Research Foundation of Korea(NRF) grant funded by the Korea government (MSIT) (2019R1F1A1053060).

Notes

Author Contribution

Conceptualization: Sihun Park, Woojae Han, Tae Hui Kim. Formal analysis: Tae Hui Kim. Investigation: Sihun Park. Methodology: Tae Hoon Kong, Jaehyun Han. Project administration: Woojae Han, Young Joon Seo. Supervision: Tae Hui Kim. Writing—original draft: Sihun Park, Woojae Han. Writing—review & editing: all authors.

Fig. 1.
Flowchart of the study identification, eligibility, and inclusion process based on the Preferred Reporting Items for Systematic Reviews and Meta Analyses (PRISMA) criteria. PICOS: Participants, Index test, Control, Outcomes, Study design, DLB: dementia with Lewy bodies, PDD: Parkinson's disease dementia, AD: Alzheimer's disease, ERP: event-related potential, CAPD: central auditory processing disorder, PTA: puretone audiometry, OCM: outcome, MMN: mismatch negativity, ABR: auditory brainstem response.
kjorl-hns-2020-00682f1.jpg
Fig. 2.
Mean comparison between Alzheimer’s disease and age matched groups plotted by 74 articles included in the meta-analysis. Latency auditory evoked potential (A), amplitude auditory evoked potential (B), central auditory processing tests (C), ear side of panel C (D), digit span (E), auditory word recall (E).
kjorl-hns-2020-00682f2.jpg
Table 1.
Participants, Index test, Control, Outcomes, and Study designs (PICOS) strategy used in the study
PICOS Contents
Participants Clearly mentioned as an Alzheimer disease or Parkinson’s disease dementia or Dementia with Lewy bodies
Index test All the audiological testing (i.e., Speech perception, Speech recognition, PTA, OAE, ABR, AMLR, ALR, etc.)
Control Comparison with a control group or repeated measures
Outcomes Outcome measure(s) related to audiological testing results
Study design Randomized controlled trials, non-randomized controlled trials, cohort studies (with a control comparison), and repeated measures (pre- and post- comparisons)

PTA: puretone audiometry, OAE: otoacoustic emission, ABR: auditory brainstem response, AMLR: auditory middle latency response, ALR: auditory late latency response

Table 2.
Summary of meta-analysis results for 72 articles in Alzheimer’s disease and Egger’s regression
Characteristic Studies Effect size and 95% CI
Homogeneity tests
Standard means diff Lower limit Upper limit p Q df (Q) p I2
N100 latency 12 0.672 -0.051 1.395 0.069 153.733 9 <0.001 94.15
P200 latency 10 0.129 -0.131 0.389 0.331 28.448 11 0.003 61.33
N200 latency 13 1.144 0.475 1.813 0.001 164.962 12 <0.001 92.73
P300 latency 42 1.220 0.936 1.504 <0.001 482.119 41 <0.001 91.50
P300 amplitude 31 -0.595 -0.907 -0.284 <0.001 358.502 30 <0.001 91.63
CAPD 8 -1.299 -1.512 -1.086 <0.001 8.091 7 0.325 13.49
Digit forward 12 -0.659 -0.918 -0.399 <0.001 19.162 11 0.058 42.59
Digit backward 13 -0.901 -1.179 -0.624 <0.001 24.852 12 0.016 51.71
Auditory word recall 15 -2.308 -2.767 -1.848 <0.001 339.334 14 <0.001 95.87

Egger’s regression Intercept Standard error Lower limit Upper limit p (1-tailed) p (2-tailed) df t-value

N100 latency 12.199 3.047 5.617 18.781 0.001 0.002 13 4.004
P200 latency -0.678 2.423 -5.912 4.556 0.392 0.784 13 0.280
N200 latency 6.772 2.586 1.226 12.319 0.010 0.020 14 2.619
P300 latency 6.089 1.067 3.959 8.219 <0.001 <0.001 67 5.706
P300 amplitude -6.934 1.576 -10.093 -3.775 <0.001 <0.001 54 4.401
CAPD -3.461 0.700 -4.932 -1.990 <0.001 <0.001 18 4.943
Digit forward -2.997 2.715 -9.047 3.054 0.148 0.296 10 1.104
Digit backward -4.315 2.510 -9.840 1.210 0.057 0.114 11 1.719
Auditory word recall 2.671 1.538 -0.528 5.870 0.048 0.097 21 1.736

CI: confidence interval, CAPD: Central auditory processing disorder

Table 3.
Summary of 5 studies for patients with dementia with Lewy body in terms of participants’ characteristics, measurements, and outcomes
Study Participants
Measurements
Outcomes
Number, age and sex Control Characteristics Stimuli Conditions
Bonanni, et al. [18] Number of participants DLB group: patients with DLB Education (year) P300 P300 Reliable P300 recording (% of the selected population)
DLB=32 DLB=9.0±4.0 Intensity=75 dB Electrode montage=Fp1, Fp2, F3, F4, C3, C4, P3, P4, O1, O2, F7, F8, T3, T4, T5, T6, Cz, Fz, Pz DLB=72 / control=92
Control=50 Control group: age, gender, education, occupational matching control Control=8.2±4.0 Duration of stimuli=150 ms (rise-fall and the plateau times 5 and 140 ms, respectively) Presentation rate=random with a minimum inter-stimulus interval of 1.1 seconds and a maximum interval of 4 seconds Delayed P300 (% of the patient population with reliable P300 response)
Age (mean±SD) MMSE Fz: 92, Cz: 85, Pz: 42
DLB=69.9±4.7 DLB=22.8±1.4 Standard=500 Hz tones Filter=set at 0.15 Hz and 100 Hz, and averaged with a dwell time of 0.5 ms, 2000 Hz sampling rate, 100 ms of pre-stimulus baseline recording Reduced P300 amplitude (% of the patient population with reliable P300 response)
Control=72.0±4.1 Control=29.0±0.8 Deviant=1000 Hz tones Reference=one earlobe was used as online reference, with offline averaging with the other earlobe Fz: 0, Cz: 12, Pz: 19
Sex [male gender (%)] Presentation ratio=training 4/1-8/1 and during recording purposes 5/1 Anterior to posterior amplitude distribution gradient (% of the patient population with reliable P300 response): 77
DLB=53.1 Latency=considered delayed if the peak latency was at least 2SD longer than the controls mean value N100, N200, and P200=detected at the Fz, Cz and Pz electrode for each subject separately Posterior to anterior amplitude distribution gradient (% of the patient population with reliable P300 response): 0
Control=65
Kurita, et al. [19] Number of participants DLB group: patients with DLB MMSE N1, P2, N2, and P3 1000/2000 Hz tone stimuli N1, P2, N2 and P3 Evoked potential were recorded from the Pz DLB latency
DLB=24 DLB=20.1±6.3 N1=104.7±16.0 / P2=189.2±26.5 / N2=284.2±52.2 / P3=429.5±87.7
Control=20 Control group: aged matching control Control=28.5±2.3
Age (mean±SD) Disease duration (year) Control
DLB=72.7±8.8 DLB=2.7±2.1 N1=95.6±22.6 / P2=181.9±30.3 / N2=242.2±37.7 / P3=378.8±44.7
Control=71.4±10.2 Control=N/A
Sex (M:F)
DLB=16:8
Control=11:6
Brønnick, et al. [17] Number of participants DLB group: patients with DLB Education (year) MMN MMN MMN
DLB=17 DLB=9.6±3.0 Intensity=65 dB/inter-stimulus interval (350 ms) Electrode montage: FP1, FP2, F3, Fz, F4, C3, Cz, C4, P3, Pz, P4, O1 of the standard 10-20 system Latency: did not show significantly different latencies between the groups [F(4,77)=0.507, p=0.730]
HC=18 HC group: aged matching control HC=9.6±3.3
Age (mean±SD) Disease duration (year) Standard=spectrally compound tone (500, 1000, and 1500 Hz) / duration (75 ms with 5 ms rise and fall time)/90% sound occurred Reference: linked ears were used as a common reference
DLB=77.3±7.3 DLB=2.9±1.4 Gain: 50 k Peak amplitude: DLB group did not differ from the healthy controls [t(29)=0.451, p=0.64], nor from the PD group [t(30)=0.72, p=0.475], or the AD group [t(28)=1.33, p=0.194] area: PDD group had a significantly less negative MMN area than the DLB group [t(26)=2.54, p=0.017) / DLB group did not differ from the healthy controls [t(32)=0.46, p=0.643], nor from the PD group [t(29)=0.03, p=0.976], or the AD group [t(28)=1.28, p=0.233]
HC=73.1±4.5 HC=N/A Filter: low-pass filter at 40 Hz, and a high-pass filter at 0.3 Hz with a 12 dB attenuation
Sex (M:F) MMSE Deviant=spectrally compound tone (500, 1000, and 1500 Hz) / duration (25 ms with 5 ms rise and fall time)/10% sound occurred
DLB=10:7 DLB=21.1±5.8 Impedance: below 5 k ohm
HC=4:14 HC=29.1±1.4
Maeshima, et al. [27] Number of participants DLB group: patients with DLB Education (year) Word fluency test (WFT), auditory-verbal learning test (AVLT), Raven’s Coloured Progressive Matrices (RCPM), state-trait anxiety inventory (STAI), self-rating depression scale (SDS), category-based (CWFT), letter-based (LWFT) Subjective measurements AVLT-immediate recall
DLB=3 DLB=9.7±2.1 DLB: 15.3±7.1 healthy elderly control: 33.4±7.5
HC=32 Healthy elderly control group: healthy elderly participants Healthy elderly control=10.2±2.9
Age (mean±SD) AVLT-delayed recall
DLB=75.0±8.7 MMSE DLB: 0±0 healthy elderly control: 4.91±3.34
Healthy elderly control=72.5±4.7 DLB=14.7±5.7
Sex (M:F) Healthy elderly control=27.8±1.6
N/A
Wesnes, et al. [20] Number of participants Placebo group: no therapeutic group (including 16 PDD, 8 DLB patients) MMSE Simple reaction time test, choice reaction time test, immediate word recognition test, delayed word recognition test Subjective measurements Immediate word recognition test [overall change, LS means (CI)]
DLB=21 Placebo group=20.8±3.7
Age (mean±SD) Memantine group=20.4±3.6 Placebo: -5.48 (-14 to 3.1)
Placebo group=76.2±4.8 Memantine: 8.73 (0.9 to 16.6)
Memantine group=76.1±6.5 Memantine group: therapeutic group (including 6 PDD, 6DLB patients) Duration of PD before onset of dementia Delayed word recognition test [overall change, LS means (CI)]
Sex (M:F)
Placebo group=18:6 Placebo group=5.2±3.7 Placebo: 0.77 (-8.5 to 10)
Memantine group=6:6 Memantine group=4.6±3.7 Memantine: 16.41 (8 to 24.8)

DLB: dementia with Lewy bodies, PDD: Parkinson’s disease dementia, PD: Parkinson’s disease, AD: Alzheimer’s disease, HC: health control, MMN: mismatch negativity, MMSE: Mini-Mental State examination

Table 4.
Summary of 6 studies for patients with Parkinson’s disease dementia in terms of participants’ characteristics, measurements, and outcomes
Study Participants
Measurements
Outcomes
Number, age and sex Control Characteristics Stimuli Conditions
Kurita, et al. [19] Number of participants PDD-H group: PDD patients with symptoms of visual hallucinations MMSE N1, P2, N2, and P3 N1, P2, N2, and P3 PDD-H latency
PDD-H=11 PDD-H=20.5±3.2 1000/2000 Hz tone stimuli Evoked potential were recorded from the Pz N1=99.0±11.1 / P2=181.5±22.5 /
PDD-N=6 PDD-N=20.3±1.9 N2=283.2±52.3 / P3=436.4±89.3
Control=20 Control=28.5±2.3 PDD-N latency
Age (mean±SD) PDD-N group: PDD patients with no symptoms of visual hallucinations Disease duration (year) N1=91.3±10.3 / P2=194.7±22.8 /
PDD-H=74.6±7.7 PDD-H=9.1±5.2 N2=269.0±49.5 / P3=445.3±66.1
PDD-N=72.7±3.6 PDD-N=9.3±7.6 Control
Control=71.4±10.2 Control=N/A N1=95.6±22.6 / P2=181.9±30.3 /
Sex (M:F) Control group: aged matching control N2=242.2±37.7 / P3=378.8±44.7
PDD-H=5:6
PDD-N=4:2
Control=11:6
Brønnick, et al. [17] Number of participants PDD group: patients with PDD HC group: aged matching healthy control Education (year) MMN MMN MMN
PDD=15 PDD=9.8±3.4 Intensity=65 dB / inter-stimulus interval (350 ms) Electrode montage: FP1, FP2, F3, Fz, F4, C3, Cz, C4, P3, Pz, P4, O1 of the standard 10-20 system Latency: did not show significantly different latencies between the groups [F(4,77)=0.507, p=0.730]
HC=18 HC=9.6±3.3
Age (mean±SD) Disease duration (year) Standard=spectrally compound tone (500, 1000, and 1500 Hz) / duration (75 ms with 5 ms rise and fall time)/90% sound occurred Peak amplitude: DLB group did not differ from the healthy controls [t(29)=0.451, p=0.64], nor from the PD group [t(30)=0.72, p=0.475], or the AD group [t(28)=1.33, p=0.194]
PDD=72.7±6.5 PDD=2.2±1.1 Reference: linked ears were used as a common reference
HC=73.1±4.5 HC=N/A
Sex (M:F) MMSE Deviant=spectrally compound tone (500, 1000, and 1500 Hz) / duration (25 ms with 5 ms rise and fall time)/10% sound occurred Gain: 50 k / filter: low-pass filter at 40 Hz, and a highpass filter at 0.3 Hz with a 12 dB attenuation Area: PDD group had a significantly less negative MMN area than the DLB group [t(26)=2.54, p=0.017]/DLB group did not differ from the healthy controls [t(32)=0.46, p=0.643], nor from the PD group [t(29)=0.03, p=0.976], or the AD group [t(28)=1.28, p=0.233]
PDD=12:3 PDD=21.1±3.5
HC=4:14 HC=29.1±1.4 Impedance: below 5 k ohm
Schmitt, et al. [30] Number of participants Experimental group: therapeutic group (183 patients) Placebo group: no therapeutic group (179 patients) No specific information Alzheimer’s Disease Assessment Scale – cognitive subscale [word recall, object naming, orientation, word recognition, remembering test instructions, commands, language (clarity of speech), comprehension, word finding, constructional praxis, ideational praxis] Subjective measurements Domains (memory, language, and praxis), the standard effect sizes (Cohen d) ranged from 0.27 to 0.30
PDD=362
Age
N/A
Sex
N/A
Yamamoto, et al. [28] Number of participants PDD group: patients with PDD MMSE P300 P300 P300
PDD=7 Twenty-two patients were clinically demented according to MMSE (less than 24/30), three patients (more than 28/30) Frequent-rare sequence = randomly presented binaurally at 75 dB SPL and 0.7 Hz with total of 30 rare events Evoked potential were recorded from the vertex (Cz) P300 latency showed a strong inverse correlation with the MMSE score in mildly demented patients with MMSE scores of more than 17 (r=-0.808; p<0.001)
Age
Mean=72.1 (range 44-86)
Sex (M:F) Standard=1000 Hz (80% sound occurred) / deviant=2000 Hz (20% sound occurred)
15:10
Wesnes, et al. [20] Number of participants Placebo group: no therapeutic group (including 16 PDD, 8 DLB patients) MMSE simple reaction time test, choice reaction time test, immediate word recognition test, delayed word recognition test Subjective measurements Immediate word recognition test [overall change, LS means (CI)]
PDD=30 Placebo group=20.8±3.7
Age (mean±SD) Memantine group=20.4±3.6 Placebo: -5.48 (-14 to 3.1)/memantine: 8.73 (0.9 to 16.6)
Placebo group=76.2±4.8 Duration of PD before onset of dementia
Memantine group=76.1±6.5 Memantine group: therapeutic group (including 6 PDD, 6 DLB patients) Delayed word recognition test [overall change, LS means (CI)]
Sex (M:F) Placebo group=5.2±3.7
Placebo group=18:6 Memantine group=4.6±3.7 Placebo: 0.77 (-8.5 to 10)/memantine: 16.41 (8 to 24.8)
Memantine group=6:6
Claus and Mohr [29] Number of participants PDD group: patients with PDD Education (year) Verbal dichotic listening task (free recall and selective allocation to the left or right ear) Subjective measurements Dichotic listening tasks revealed statistically significant differences between groups [F(4)=12.3; p<0.0001]/laterality indices revealed significant differences between groups [F(4)=4.73; p<0.01] and as a function of order of recall [F(2)=40.9; p<0.0001]
PDD=10 PDD=14.2±1.8
Healthy control=22 Healthy control group: healthy subjects Healthy control=15.6±2.4
Age (mean±SD)
PDD=68.0±6.5 Symptom duration (year)
Healthy control=59.8±6.7 PDD=7.8±4.9
Sex (M:F) Healthy control=N/A
N/A

DLB: dementia with Lewy bodies, PDD: Parkinson’s disease dementia, PD: Parkinson’s disease, AD: Alzheimer’s disease, HC: health control, MMN: mismatch negativity, MMSE: Mini-Mental State examination

Table 5.
The audiological tests having significant differences when comparing the normal control group with health cognition
Auditory event-related potentials
Central auditory processing tests
N100L P200L N200L P300L P300A MMN CAPD test Digit forward Digit backward Auditory word recall
AD x x 0 0 0 N/A 0 0 0 0
DLB x x 0 0 0 Sig. b/t two N/A N/A N/A 0
PDD x x x 0 N/A groups 0 N/A N/A N/A

L: latency, A: amplitude, N/A: not applicable, MMN: mismatch negativity, CAPD: Central auditory processing disorder, AD: Alzheimer’s disease, DLB: dementia with Lewy bodies, PDD: Parkinson’s disease dementia, 0: significance, x: no significance, N/A: not applicable due to no test results

REFERENCES

1. Nadhimi Y, Llano DA. Does hearing loss lead to dementia? A review of the literature. PsyArXiv [preprint], 27 May 2020. Available from: https://doi.org/10.31234/osf.io/zgkvr.
crossref
2. Häggström J, Hedrstierna C, Rosenhall U, Östberg P, Idrizbegovic E. Prognostic value of a test of central auditory function in conversion from mild cognitive impairment to dementia. Audiol Neurootol 2020;25(5):276-82.
crossref pmid
3. Howe AS. Meta-analysis of the endogenous N200 latency eventrelated potential subcomponent in patients with Alzheimer’s disease and mild cognitive impairment. Clin Neurophysiol 2014;125(6):1145-51.
crossref pmid
4. Howe AS, Bani-Fatemi A, De Luca V. The clinical utility of the auditory P300 latency subcomponent event-related potential in preclinical diagnosis of patients with mild cognitive impairment and Alzheimer’s disease. Brain Cogn 2014;86:64-74.
crossref pmid
5. Hedges D, Janis R, Mickelson S, Keith C, Bennett D, Brown BL. P300 amplitude in Alzheimer’s disease: A meta-analysis and metaregression. Clin EEG Neurosci 2016;47(1):48-55.
crossref pmid pdf
6. Kim YB. A topographically correlational study of P300 and MMN (mismatch negativity) in healthy subjects. Korean J Clin Lab Sci 2007;39(3):256-63.

7. Hillyard SA, Hink RF, Schwent VL, Picton TW. Electrical signs of selective attention in the human brain. Science 1973;182(4108):177-80.
crossref pmid
8. Moussaud S, Jones DR, Moussaud-Lamodière EL, Delenclos M, Ross OA, McLean PJ. Alpha-synuclein and tau: Teammates in neurodegeneration? Mol Neurodegener 2014;9:43.
crossref pmid pmc
9. Duda JE, Giasson BI, Mabon ME, Lee VMY, Trojanowski JQ. Novel antibodies to synuclein show abundant striatal pathology in Lewy body diseases. Ann Neurol 2002;52(2):205-10.
crossref pmid
10. Taylor A, Yardley C. Advocacy, education, and the role of not-forprofit organizations in Lewy body dementias. Alzheimers Res Ther 2014;6(5):59.
crossref pmid pmc
11. Hardy CJ, Marshall CR, Golden HL, Clark CN, Mummery CJ, Griffiths TD, et al. Hearing and dementia. J Neurol 2016;263(11):2339-54.
crossref pmid pmc
12. Goll JC, Kim LG, Hailstone JC, Lehmann M, Buckley A, Crutch SJ, et al. Auditory object cognition in dementia. Neuropsychologia 2011;49(9):2755-65.
crossref pmid pmc
13. Goll JC, Kim LG, Ridgway GR, Hailstone JC, Lehmann M, Buckley AH, et al. Impairments of auditory scene analysis in Alzheimer’s disease. Brain 2012;135(Pt 1):190-200.
crossref pmid
14. Cheng CH, Wang PN, Hsu WY, Lin YY. Inadequate inhibition of redundant auditory inputs in Alzheimer’s disease: An MEG study. Biol Psychol 2012;89(2):365-73.
crossref pmid
15. Grahn JA, Brett M. Impairment of beat-based rhythm discrimination in Parkinson’s disease. Cortex 2009 Jan;45(1):54-61.
crossref pmid
16. Gates GA, Mills JH. Presbycusis. Lancet 2005;366(9491):1111-20.
crossref pmid
17. Brønnick KS, Nordby H, Larsen JP, Aarsland D. Disturbance of automatic auditory change detection in dementia associated with Parkinson’s disease: A mismatch negativity study. Neurobiol Aging 2010;31(1):104-13.
crossref pmid
18. Bonanni L, Franciotti R, Onofrj V, Anzellotti F, Mancino E, Monaco D, et al. Revisiting P300 cognitive studies for dementia diagnosis: Early dementia with Lewy bodies (DLB) and Alzheimer disease (AD). Neurophysiol Clin 2010;40(5-6):255-65.
crossref pmid
19. Kurita A, Murakami M, Takagi S, Matsushima M, Suzuki M. Visual hallucinations and altered visual information processing in Parkinson disease and dementia with Lewy bodies. Mov Disord 2010;25(2):167-71.
crossref pmid
20. Wesnes KA, Aarsland D, Ballard C, Londos E. Memantine improves attention and episodic memory in Parkinson’s disease dementia and dementia with Lewy bodies. Int J Geriatr Psychiatry 2015;30(1):46-54.
crossref pmid
21. Huang X, Lin J, Demner-Fushman D. Evaluation of PICO as a knowledge representation for clinical questions. AMIA Annu Symp Proc 2006;2006:359-63.
pmid pmc
22. Moher D, Shamseer L, Clarke M, Ghersi D, Liberati A, Petticrew M, et al. Preferred reporting items for systematic review and metaanalysis protocols (PRISMA-P) 2015 statement. Syst Rev 2015;4(1):1.
crossref pmid pmc
23. McKeith IG, Galasko D, Kosaka K, Perry EK, Dickson DW, Hansen LA, et al. Consensus guidelines for the clinical and pathologic diagnosis of dementia with Lewy bodies (DLB): Report of the consortium on DLB international workshop. Neurology 1996;47(5):1113-24.
crossref pmid
24. Higgins JPT, Altman DG. Assessing risk of bias in included studies. In: Higgins JPT, Green S, eds. Cochrane Handbook for Systematic Reviews of Interventions. Chichester: John Wiley & Sons; 2008. p. 187-241.

25. Borenstein M, Hedges LV, Higgins JP, Rothstein HR. Introduction to meta-analysis. Chichester: John Wiley & Sons; 2009.

26. Egger M, Davey Smith G, Schneider M, Minder C. Bias in metaanalysis detected by a simple, graphical test. BMJ 1997;315(7109):629-34.
crossref pmid pmc
27. Maeshima S, Osawa A, Maeshima E, Shimamoto Y, Sekiguchi E, Kakishita K, et al. Usefulness of a cube-copying test in outpatients with dementia. Brain Inj 2004;18(9):889-98.
crossref pmid
28. Yamamoto M, Kachi T, Igata A. Pain-related somatosensory evoked potentials in dementia. J Neurol Sci 1996;137(2):117-9.
crossref pmid
29. Claus JJ, Mohr E. Attentional deficits in Alzheimer’s, Parkinson’s, and Huntington’s diseases. Acta Neurol Scand 1996;93(5):346-51.
crossref pmid
30. Schmitt FA, Aarsland D, Brønnick KS, Meng X, Tekin S, Olin JT. Evaluating rivastigmine in mild-to-moderate Parkinson’s disease dementia using ADAS-cog items. Am J Alzheimers Dis Other Demen 2010;25(5):407-13.
crossref pmid
Editorial Office
Korean Society of Otorhinolaryngology-Head and Neck Surgery
103-307 67 Seobinggo-ro, Yongsan-gu, Seoul 04385, Korea
TEL: +82-2-3487-6602    FAX: +82-2-3487-6603   E-mail: kjorl@korl.or.kr
About |  Browse Articles |  Current Issue |  For Authors and Reviewers
Copyright © Korean Society of Otorhinolaryngology-Head and Neck Surgery.                 Developed in M2PI
Close layer
prev next