


Introduction
Pediatric sleep-disordered breathing is viewed as a continuum of severity from partial obstruction of the upper airway that produces snoring, to increased upper airway resistance, to continuous episodes of complete upper airway obstruction or obstructive sleep apnea (OSA). Pediatric OSA can cause morbidity in children and may lead to growth failure, cardiovascular dysfunction, and behavioral abnormalities. This disease is caused by narrowing of the airway that may occur at several sites; most commonly, enlarged tonsils and adenoids are the source of nasopharyngeal and oropharyngeal narrowing.
The adenoids are part of the peripheral lymphatic tissue, mainly composed of B-cell lymphocytes and T cells [1]. The adenoids are part of Waldeyer’s ring, and they serve as a defense against inhaled antigens, such as microbes and allergens [2,3]. The adenoids are involved in the immune response, including the innate and adaptive immune responses, because of their position in the respiratory tract. After chronic stimulation by inhaled antigens, the adenoids may enlarge to almost fill the space between the choana and nasopharynx. Enlarged adenoids can cause negative reactions, such as interference with the passage of nasal airflow. Adenoidal hypertrophy occurs in about one third of the general pediatric population and constitutes the most frequent otorhinolaryngological indication for surgical intervention [4,5]. Adenoidal hypertrophy provokes symptoms including nasal obstruction, snoring, sleep apnea, recurrent otitis media, and recurrent rhinosinusitis infections [6]. There are many modalities to measure adenoid size and the relationships with the upper airways, including acoustic rhinometry, rhinomanometry, nasal endoscopy, and radiologic tools such as the adenoid view [7]. Among these tools, the most commonly used are the adenoid view and nasal endoscopy. Nasal endoscopy has the advantage that it provides direct visualization of the nasopharynx. With the adenoid view, we can assess relationships of the adenoids and upper airways.
Enlargement and hypertrophy of the adenoids could be caused by continuous antigenic stimulation associated with chronic inflammation. The physical consequence of adenoidal enlargement is the limitation of airflow. In children, the two most common inflammatory conditions with nasal obstruction are allergy and infection. Some studies have assessed the relationship between adenoid size and allergic rhinitis. Commonly, it has been thought that allergic stimulation including allergic rhinitis stimulates lymphoid tissue, eventually leading to adenoid hypertrophy. But, interestingly, Ameli, et al. [8] found an inverse relationship between adenoidal hypertrophy and allergic rhinitis. They reported that allergic rhinitis causes large turbinates because of continuous allergic stimulation, and large turbinates block the passage of allergens to the adenoids, reducing adenoid size.
Given these findings, further studies are needed to determine the relationship between asthma and adenoid size. Asthma is one of various allergic diseases, and it can also affect allergenic stimulation to the airflow tract, including the adenoids. Thus, this study aimed to identify the relationship between adenoid size and asthma in a group of children.
Subjects and Method
Subjects and evaluation
We conducted a retrospective review of medical records of pediatric patients who visited one tertiary hospital in Korea on suspicion of allergic disease from January 2011 to June 2016. This study protocol was approved by the Samsung Medical Center Institutional Review Board (IRB No. SMC 2019-05-094-001) and the informed consents were waived. This study included pediatric patients with or without atopy and asthma, and analyzed adenoid size in normal, atopic and asthma patients. All patients were less than 15 years old and underwent laboratory tests (Pharmacia CAP system and total IgE) for atopy diagnosis, and a lateral X-ray view of the skull (adenoid view) for the diagnosis of adenoid hypertrophy. Asthma was diagnosed according to the diagnosis criteria in the Korean guideline for asthma [9]. Patients were diagnosed with asthma if they had a history of respiratory symptoms (dyspnea, wheezing, chest discomfort, cough), identified variable expiratory airflow limitation (by the bronchial provocation test), and had a history of treatment by pediatric respiratory doctors. If patients were too young to execute provocation test, asthma was diagnosed with history and physical examination by pediatric doctors.
A total of 2063 pediatric patients completed both the laboratory tests and adenoid view and were enrolled in this study (629 asthmatic patients and 1434 non-asthmatic patients). We divided these patients into 4 groups of 100 pediatric in each groups. These patients were randomly selected from the 629 asthmatic and 1434 non-asthmatic patients according to the diagnosis of asthma and atopy (Table 1). Patients were excluded from the study if they met any of the exclusion criteria: 1) symptoms of acute respiratory infection; 2) prior tonsil or adenoid surgery; or 3) a history of craniofacial, neuromuscular, or genetic disorders.
Adenoid size was evaluated with a lateral X-ray view of the skull using the adenoidal-nasopharyngeal ratio (A/N ratio) of Fujioka, et al. [10] Adenoidal measurement (‚ÄúA‚ÄĚ) was the distance from the point of maximal adenoidal convexity along the inferior margin of the adenoid shadow (A1) to a line drawn along the straight part of the anterior margin of the basiocciput (B). Nasopharyngeal measurement (‚ÄúN‚ÄĚ) was the distance between the posterior superior edge of the hard palate (C) to the anteroinferior edge of the sphenobasioccipital synchondrosis (D) (Fig. 1).
Statistical analysis
All statistical analyses were performed with SPSS for Windows version 20.0 (IBM Corp., Armonk, NY, USA). Adenoid size differences were compared between the four groups. Demographic differences between the four groups and adenoid size were compared using analysis of variance. Tukey and Bonferroni’s method were used for post-hoc analysis. Statistical significance was set at p<0.05.
Results
Demographic data
We classified patients into 4 groups of 100 patients each according to the presence of atopy and asthma: group 1, asthma absent, atopy absent; group 2, asthma absent, atopy present; group 3, asthma present, atopy absent; and group 4, asthma present, atopy present. The groups did not differ significantly by sex or age. The mean age was 4.56 years in group 1, 4.11 years in group 2, 3.84 years in group 3, and 4.50 years in group 4. For atopy diagnosis, patients underwent the Pharamacia CAP test and IgE test. In the atopic groups (groups 2 and 4), IgE for D.pteronyssinus and D.farinae and total IgE were higher than for the non-atopic groups (groups 1 and 3) (Table 1).
Adenoid size differences according to the presence of asthma and atopy
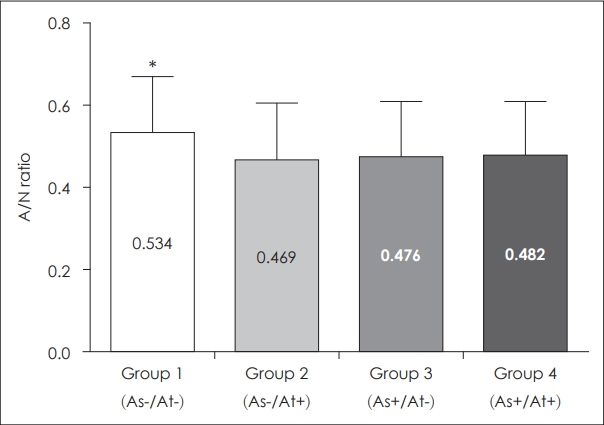
Next, we evaluated the difference in adenoid size between the 4 groups categorized by the presence of asthma and atopy. The mean A/N ratio was 0.534 in group 1, 0.469 in group 2, 0.476 in group 3, and 0.482 in group 4. The highest value was found for group 1, while the other groups showed similar values (Table 2, Fig. 2). The mean A/N ratio differed significantly between groups 1 and 2, groups 1 and 3, and groups 1 and 4 (p<0.001). There was no difference between groups 2 and 3 (p=0.573), groups 2 and 4 (p=0.994), or groups 3 and 4 (p=0.732).
Among patients without asthma (groups 1 and 2), adenoid size was significantly smaller in the patients with atopy compared to those without atopy. In the patients without atopy (groups 1 and 3), adenoid size was significantly smaller in the patients with asthma compared to those without asthma. In the patients with asthma and atopy (group 4), adenoid size was significantly smaller compared to the patients without asthma and atopy (group 1). Among patients with atopy (groups 2 and 4), adenoid size did not differ significantly between patients with and without asthma. Among the patients with asthma (groups 3 and 4), adenoid size did not differ significantly between patients with and without atopy.
Discussion
Nasal obstruction is a common nasal symptom in the pediatric population. Nasal obstruction during childhood is usually associated with enlarged adenoids, but other causes must be considered. Adenoid hypertrophy is associated with pediatric OSA. Pediatric OSA is caused by fixed and/or dynamic narrowing of the airway. Enlarged tonsils and adenoids are the most common sources of nasopharyngeal and oropharyngeal narrowing.
The adenoids are composed of lymphatic tissue, including B-cell and T cell lymphocytes, and they are part of Waldeyer’s ring that encircles the pharynx. The adenoids are involved in the immune response including both innate and adaptive immunity, and they serve as a defense mechanism against inhaled antigens. After chronic stimulation by inhaled antigens, the adenoids may enlarge. Enlarged adenoids can almost completely fill the space between the choana and nasopharynx, provoking symptoms including nasal obstruction, snoring, sleep apnea, recurrent otitis media, and recurrent rhinosinusitis infections.
Allergic rhinitis is common in children and can also lead to nasal symptoms. Allergic rhinitis and adenoid hypertrophy may be related. Some studies have investigated the relationship between allergic rhinitis and adenoid size and found that allergic stimulation, such as allergic rhinitis that stimulates the lymphoid tissue, can cause adenoid hypertrophy. However, Ameli, et al. [8] suggested that adenoidal hypertrophy and allergic rhinitis have an inverse relationship. They reported that allergic rhinitis triggers continuous allergic stimulations that cause large turbinates, and large turbinates block the passage of allergens to the adenoids. Ultimately, these reactions result in small adenoids.
Asthma is one of the most prevalent chronic diseases in children [11]. The prevalence of asthma has rapidly increased worldwide over the past decades [12]. Asthma is associated with many upper respiratory diseases, especially allergic rhinitis. Most asthma patients also have accompanying rhinitis, both allergic and non-allergic. Since an inverse relationship may exist between adenoid hypertrophy and allergic rhinitis, we aimed to determine the relationship between adenoid hypertrophy and asthma in children.
This retrospective cohort study demonstrated a relationship between adenoid size and asthma. In our study, adenoid size had an inverse relationship to asthma or atopy. Adenoid size was significantly smaller in patients with asthma compared to patients without asthma. In patients without asthma, those with atopy had significantly smaller adenoids than those without atopy. Similarly, in patients without atopy, those with asthma had significantly smaller adenoids than those without asthma. Furthermore, patients with both asthma and atopy had significantly smaller adenoids than patients without asthma and atopy. In contrast, among patients with atopy, adenoid size did not differ significantly between patients with and without asthma. Likewise, in patients with asthma, adenoid size did not differ between patients with and without atopy.
These results are similar to the findings of Ameli, et al. [8], who found a negative relationship between adenoid size and allergic rhinitis. In our cohort, adenoid size and asthma also showed a negative relationship. One explanation for the above findings is that patients with asthma or atopy have large turbinates due to continuous allergic stimulation such as allergic rhinitis, and these large turbinates prevent further allergenic stimulation on adenoid hyperplasia. In addition, if nasal obstruction (large turbinates) is caused by these preexisting conditions (asthma or atopy), there would be no additional difference in the size of adenoids due to the presence of other additional conditions. We believe this indicates that asthma and atopy do not have synergistic effects on turbinate hypertrophy.
Some studies have investigated the effect of adenoid hypertrophy on allergic disease such as allergic rhinitis and asthma. However, this is the first study to investigate the direct effect of asthma on adenoid tissue. This finding may be helpful in the clinical management of children with nasal obstruction and asthma because it shows that a precise evaluation of the nose and nasopharynx and radiologic evaluation, such as the adenoid view, is mandatory in every child with this complaint. These findings are also clinically useful for the control of nasal obstruction in children with atopy and asthma. These patients should be evaluated and managed individually, and allergic medication could be helpful.
This study had some limitations. The main limitation was the absence of immunologic evaluation or parameters. Therefore, further immunologic studies, including those that examine how allergic immune reactions affect mucosal stimulation to the turbinates and adenoid tissue, should be performed. Another limitation was that evaluation of the relationship between adenoid size and tonsillar hypertrophy was not considered. The adenoid and tonsillar tissues are similar lymphoid tissues that organize Waldeyer’s ring, and they might interact with each other. Thus, tonsillar hypertrophy and the possible impact of adenoidal hypertrophy on tonsil volume should be evaluated. It may be possible to evaluate tonsillar hypertrophy by subjective tonsillar grading such as the Brodsky tonsil grading scale [13] or radiologic evaluation. In addition, mouth breathing because of nasal obstruction caused by adenoidal hypertrophy may induce further exposure of the mouth and tonsils to infectious agents or allergens.
Large adenoids were negatively associated with allergic rhinitis and asthma. This relationship may result from a decrease in adenoid stimulation by nasal obstruction and a difference in the immune system, including allergic immune reactions, but further study is needed.